
 Normalization vs. Denormalization best practices for Power Pivot / Tabular data modeling is typically not disputed.
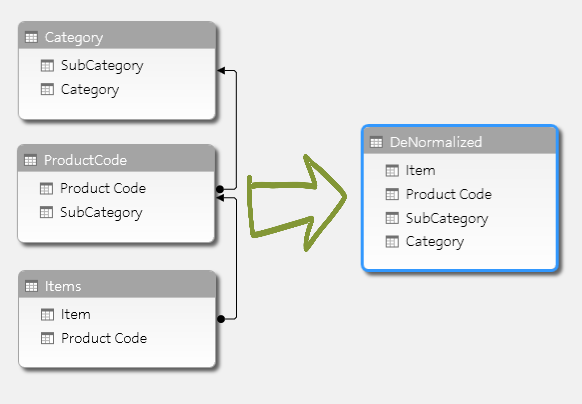
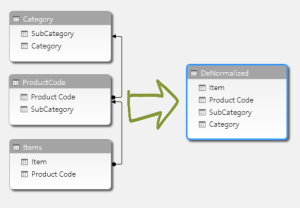
First, let’s quickly define in human terms what we are referencing when we speak of normalization vs. denormalization. Normalization is reducing data duplication by splitting dimensional data and attributes into their dimension tables. Typically, dimensions/attributes in a hierarchy are modeled in a snowflake structure (i.e. Fact Table –> Item Table –> ProductCode Table –> Category Table). Denormalization is modeling in an attempt to optimize performance by taking data from higher hierarchy tables and forcing the data into the lower dimension tables regardless of duplication. This reduces the number of joins required to report on the attributes available in the higher hierarchy data.
I will highlight first what I have read and what has resonated with me for the duration of my Power Pivot / Tabular experience in regards to normalization vs. denormalization.
Normalization vs. Denormalization top principles
More rows are preferred over more columns.
More columns are preferred over more dimensions/tables, especially if the attributes have a lower cardinality.
Everyone tends to agree (and data backs it up) that a snowflake data model should be denormalized as much as possible for performance optimization for Power Pivot / Tabular data models.
This principle of normalization vs. denormalization goes against many typical data warehouse architect’s mantra. This is one of the many in-memory concepts that is hard for them to swallow. Normalizing data reduces data warehouse disk space by reducing data duplication and dimension cardinality. The goal for Power Pivot / Tabular data modeling is two-fold and sometimes one interferes with the other. We want to reduce the cardinality AND reduce the memory footprint of our data model. Typically, the more important goal is to increase performance. By denormalizing the data model into a simple star schema, bringing in attributes from a snowflaked dimension into the lowest dimension in the hierarchy, you do not reduce cardinality. However, you do reduce the number of joins required to report on the higher level attributes. I say you do not reduce cardinality because the same number of elements for each attribute still exists in your lower dimension. They are indeed duplicated in this lower dimension; however, the cardinality has not changed!
It is important to note that you typically do not want a single, flat table structure. It has been shown in performance testing that Power Pivot / Tabular performs better when utilizing a dimension vs. an attribute in a flat fact table. As well, you will increase memory consumption if you duplicate data in the fact table due to the increase in pointers when compression occurs. Power Pivot and Tabular can compress data better if it is ordered (more on this later). Obviously, you are not able to order all attributes of a table. The more data not ordered optimally, the more pointers, and the more memory consumption.
As well, third normal form is not preferred. However, third normal form and/or single, flat tables can be utilized for prototyping. There is no harm and it may even help profile the data for designing the optimal star schema structure.
When designing a data model, one must take great care in picturing the end result. This is the structure that your end users will see when creating reports or performing ad-hoc analysis. If it is not organized in a friendly manner (i.e. dimensions split from facts), it may prove to be difficult to navigate (more on this in a later post as well).
In Power Pivot, if you want to display attributes in a separate folder, you will be forced to normalize. If the attribute cardinality is low, it is typically safe to normalize. A relationship between two large tables will degrade performance. So, it would be optimal to keep an attribute with very high cardinality in the fact table rather than normalizing. If you are only retrieving a single attribute from a dimension, it would also be optimal to denormalize.
Test, test, test. Power Pivot / Tabular surprises the best of us and provides unexpected results sometimes. Always keep the end user perspective into account and then follow these basic concepts to optimize. Normalization vs. denormalization will always have exceptions to the rule.
Great article. In the last years, I have read this article a couple of times, and recommend it to my Power BI clients.